Online Appendix for Engaging Students, Faculty, and External Professionals with a Data-Centered Capstone Project
Fall 2021 Topics, Data, and Indicators
- Inflation & Prices
- CPI
- PCE Deflator
- PPI
- Personal Income (real wage growth)
- Inflation Expectations (many measures)
- Cleveland Fed (10 year)
- St. Louis Fed (5 year forward)
- St. Louis Fed 10-year Breakeven
- NY Fed - Survey of inflation expectations
- Output, Production, & Growth
- GDP & Components
- Retail sales
- ISM Manufacturing & Non-Manufacturing
- Durable Goods
- Performance with respect to Forecasts
- Imports/Exports and Trade Balance
- Jobs and Unemployment
- Employment Situation
- Jobs Growth
- JOLTS
- Initial Jobless Claims
- ADP National Employment Report
- Labor Force Participation
- Employment to Population Ratio
- Trade & Fiscal Policy
- Imports
- Exports
- Trade Balance
- Exchange Rates
- Debt and Deficit
- Tax Revenue
- Business Sentiment and Commodity Markets
- NFIB Business Optimism Index
- Texas Manufacturing Output Survey (Dallas Fed)
- Texas Service Sector Outlook Survey (Dallas Fed)
- Fifth District Survey of Manufacturing Activity (Richmond Fed)
- Business Inventories
- Wholesale Inventories
- Business Leaders Survey
- Monetary Policy & Equity Markets
- Interest Rates
- Bond Markets (Yield Curve/TED Spread)
- FOMC minutes/speeches/dot plot
- Fed Funds Futures Markets
- Stock indices
- MBA 30-Year Mortgage Rate
- Household debt
- Consumers
- Credit Card Balances
- Consumer Confidence
- Household Sentiment
- Personal Income
- Consumer Spending
- Survey of Consumer Expectations
- University of Michigan Consumer Survey
- Housing
- Building Permits
- Case-Shiller
- Housing Starts
- Pending Home Sales
- NAR Existing Home Sales
- New Residential Sales
- CoreLogic Home Price Index
- Energy
- EIA Oil & Gas Stocks
- API Crude Oil
- Dallas Fed Energy Survey
- Baker Hughes Rig Count
- Electric Power Monthly - Average Prices of Electricity
- Weekly Retail Gasoline and Diesel Prices
- U.S. Natural Gas Net Imports & Exports
- Renewable Energy - Production and Consumption by Source (EIA)
- Transportation
- Vehicle Miles Traveled
- Total Vehicle Sales (and components)
- CPI New Vehicles in US City Average
- Domestic Auto Production and Domestic Auto Inventories
- Retail Sales - Used Car Dealers
- Rail Freight Carloads
- Revenue Passenger Miles – Airline
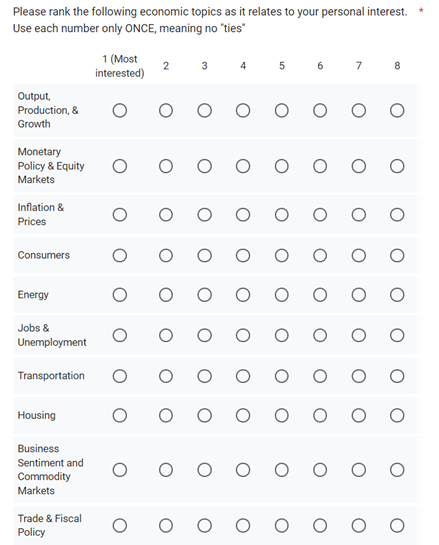
Sample Topic Interest Survey (Google Forms)
Choose one of the following topics for which you are most passionate about, and briefly describe your basic understanding of the theory, empirical evidence, and policies that apply to that topic. I am looking for honest answers, and this only needs to be as long as you think necessary. It is OK if there is some overlap. This is not graded for content, just whether or not you did it (Topics: (1) inflation & prices (2) output, production & growth (3) jobs & unemployment (4) trade & fiscal policy (5) business sentiment & commodity markets (6) monetary policy & equity markets (7) consumers (8) construction/housing (9) transportation (10) energy)
- Provide a brief description of your basic understanding and complete the survey

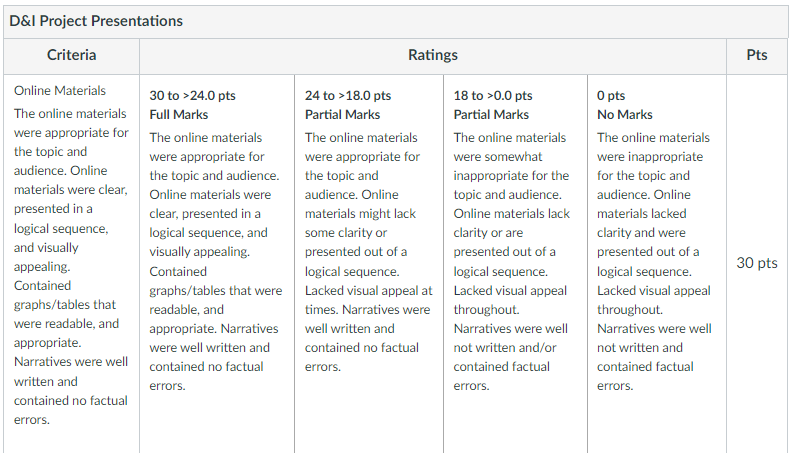
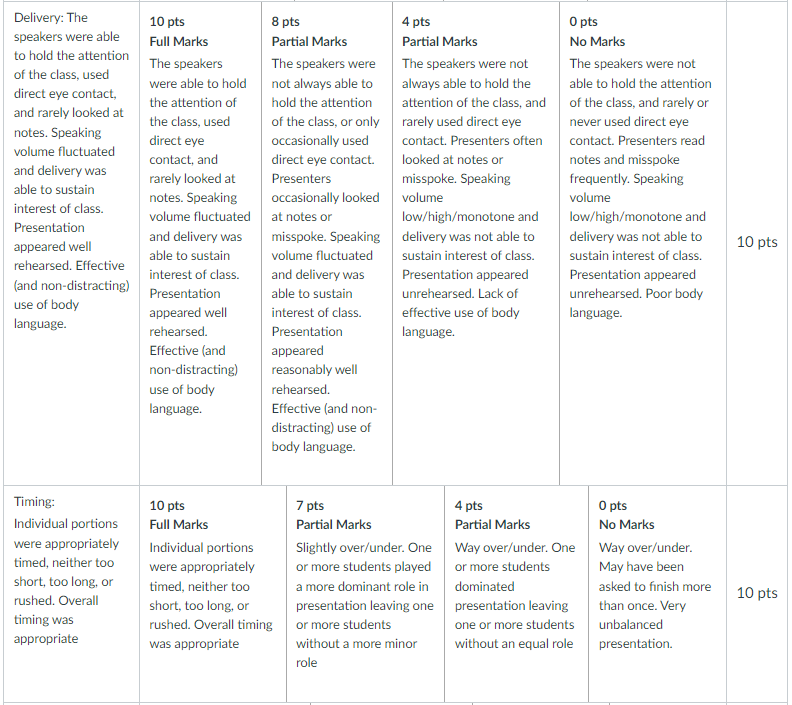
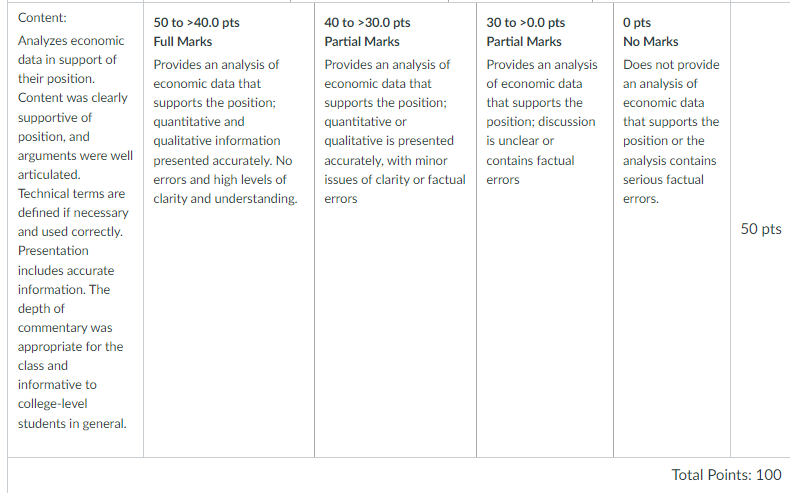
Data & Indicators Sample Rubric
A suggested rubric used in the Fall 2021 semester.


Spring 2022 Guidelines for Policy Brief Project
Overview
-
Groups of approximately 3 students will be assigned to investigate the effects of a US policy. The project will be focused on using relevant data and analysis to explore the effects of the policy. This can involve either (a) examining the effect of one or more aspect(s) of the current policy on behavior and/or outcomes or (b) investigating the effect of a proposed change in the policy.
-
Through the course of this project, each group will be facilitated by a “Project Mentor,” who will provide feedback to groups and aid in refining topic choice, accessing relevant data, formulating data analysis plans, and forming a cohesive policy brief. The Project Mentors will be JMU alumni on the Economics Executive Advisory Board. These individuals have experience outside of academia with valuable expertise across many economic topics as they apply to policy in the real world. Each group will meet twice on Zoom with a Project Mentor. While discussion with and incorporation of feedback from the Project Mentor is encouraged, the group is ultimately responsible for completing the work required to succeed in this project.
-
Each group will prepare a (1) policy brief draft, a (2) final policy brief, and (3) a class presentation, as explained below in the Deliverables section. Each group member is expected to contribute to the group in a meaningful and substantial way. Peer-evaluations will be collected and will be incorporated into each student’s final project grade. All students will be responsible for actively participating in the class discussion following each presentation. In addition, content and results from class presentations may be relevant for the final exam.
Deliverables
Policy Brief Draft (10% of project grade): After an initial meeting with the Project Mentor, each group will prepare a typed draft of the policy brief. This initial draft will serve as an outline for the final paper. At a minimum, the draft should include background on the policy and motivation, the research question(s) the group intends to answer, any relevant economic intuition, a description of the data they have compiled, a detailed plan for data analysis, and a list of at least 5 questions for the Project Mentor. This policy brief draft will be due 2 days prior to the second scheduled meeting with the Project Mentor and will be shared with the Project Mentor. The page length of the draft will vary depending primarily on the number of tables and figures, but it is likely to be around 2-3 pages.
Final Policy Brief (50% of project grade): Each group will submit a typed final draft of their policy brief focused on the effects of the chosen US policy. The brief should detail the background of the policy, features of the policy being studied and motivation, any relevant economic intuition, research question(s) explored, data and relevant data analysis, results, and conclusions. The specific structure of the brief may vary by group depending on the topics and policies being researched. Final policy briefs must be submitted within 1 week following the group’s presentation. Note that this allows for changes and/or additions based on feedback from the class presentation and the Project Mentor. Final policy briefs will be graded based on the organization, clarity, critical thought, and effective data analysis present in the paper. The page length of the final policy brief will vary depending primarily on the number of tables and figures, but it is likely to be around 3-5 pages.
Policy Brief Presentation (40% of project grade): Each group will give an approximately 30-minute presentation to the class. The presentation should introduce the policy with appropriate background, present the research question(s) and relevant economic intuition, explain data and analysis techniques, and summarize results from the policy brief research. The presentation should end with thought-provoking questions to stimulate a class discussion on the topic. Project Mentors may attend class presentations subject to their availability.
Timeline
- There will be three separate waves of deadlines for these group presentations. Specific deadlines for each group will be assigned shortly after groups are formed in the first week of class. Two groups will submit policy briefs and give class presentations in February, two in March, and two in April. Specific group meeting times with Project Mentors will be scheduled on Zoom outside of class time. A master schedule of meeting times with Project Mentors, policy brief due dates, and class presentation dates will be kept updated on Canvas once groups are assigned.