Chapter 4 Inflation
Prices for the goods and services we consume change over time. Recall that a price that you pay for a good is simply a nominal value, and does not directly take into account the amount of real work that would be performed to purchase a good. For example, if you were living in the fictional country of Titan, and a bag of chips there cost 30 units, that information is not particularly informative by itself. First, you want to know if “30 units” is a lot. If a typical wage for an hour of work was “3 units” then chips seem expensive costing you about 10 hours of work! However, if a typical wage was “300 units” for an hour of work, then chips are cheap, earned with about six minutes of work! Thus, what is most important to you is the real value.
For many goods–like tuition–the price level just seems to rise over time. Here, we see the average price level for the U.S. as measured by the Consumer Price Index (CPI). By itself, the CPI in Figure 4.1 is not particularly informative. In April 2020, the CPI measured 255.902. What we might be more interested in is the change in the CPI, or inflation seen in Figure 4.2. So if we look at the CPI from April 2019 when it measured 254.943, we could see that it increased by:
\[\left(\frac{255.902}{254.943} - 1\right)\times 100 = 0.4\%\]
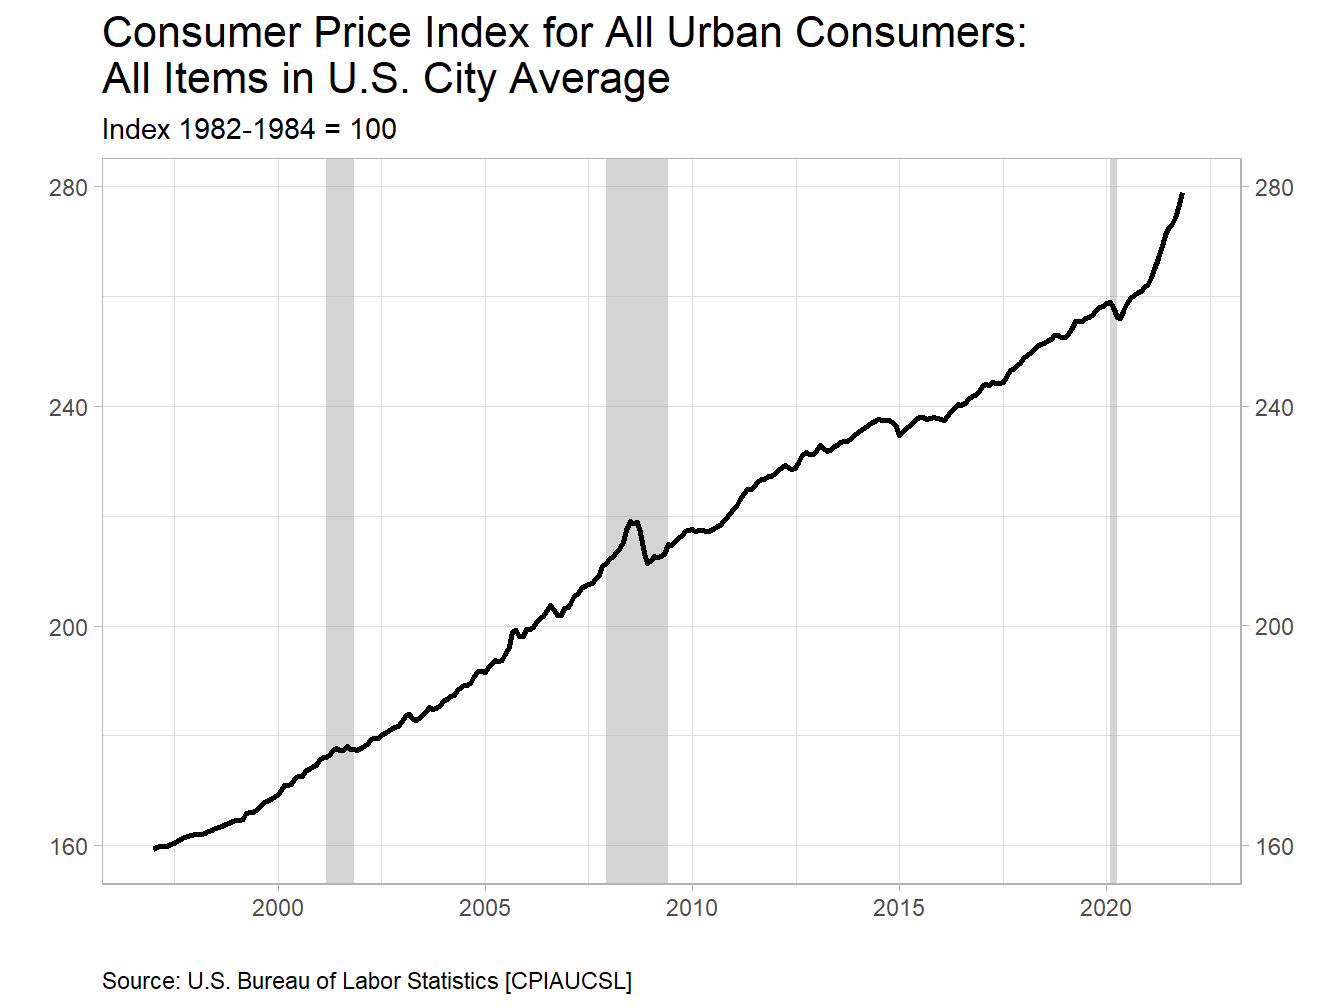
Figure 4.1: Price Levels Generally Rise Over Time
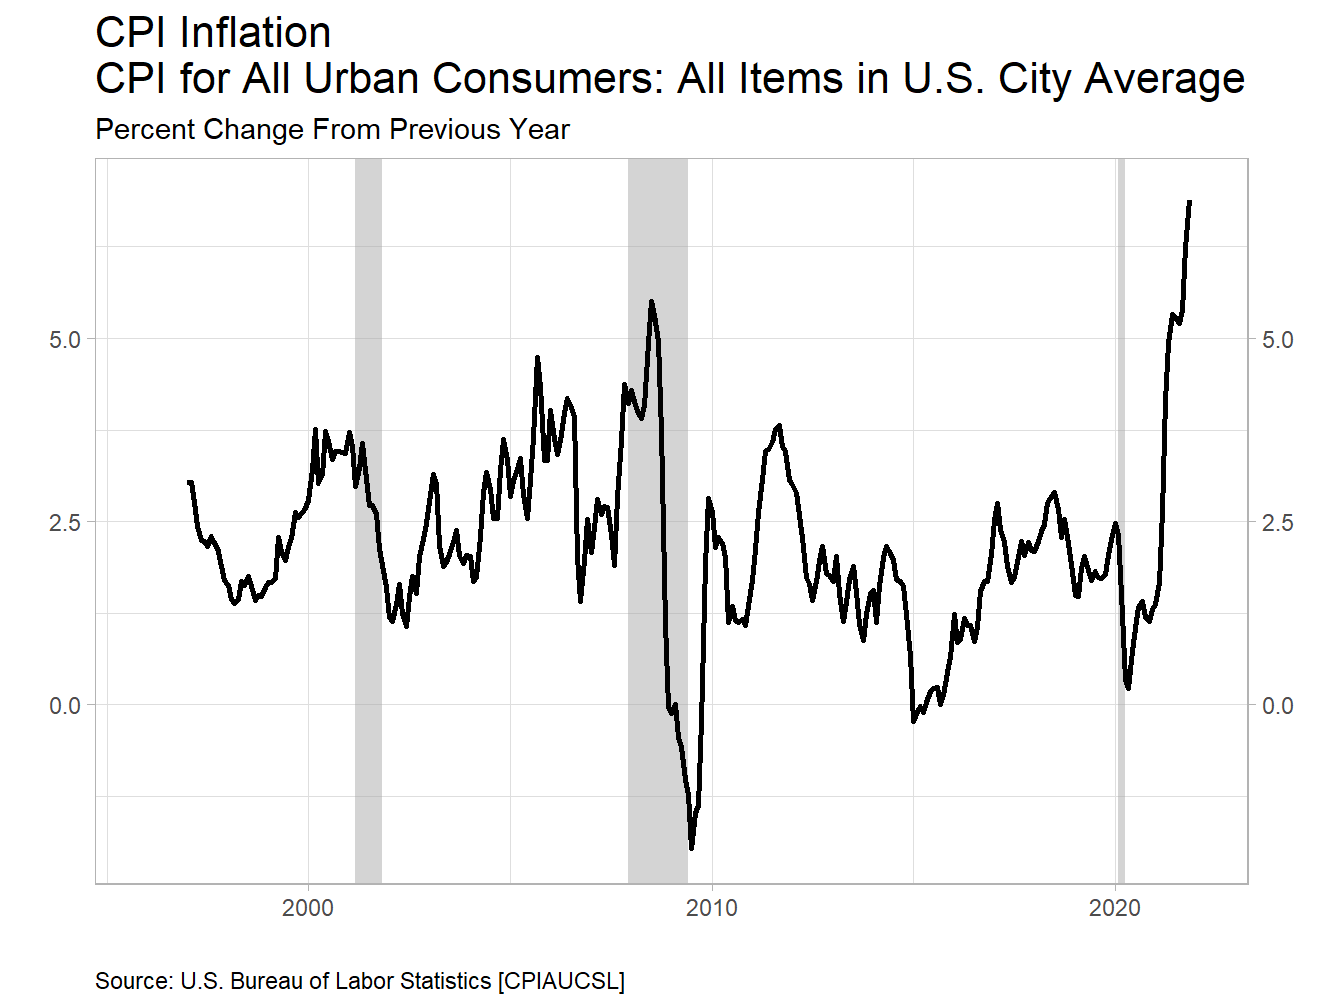
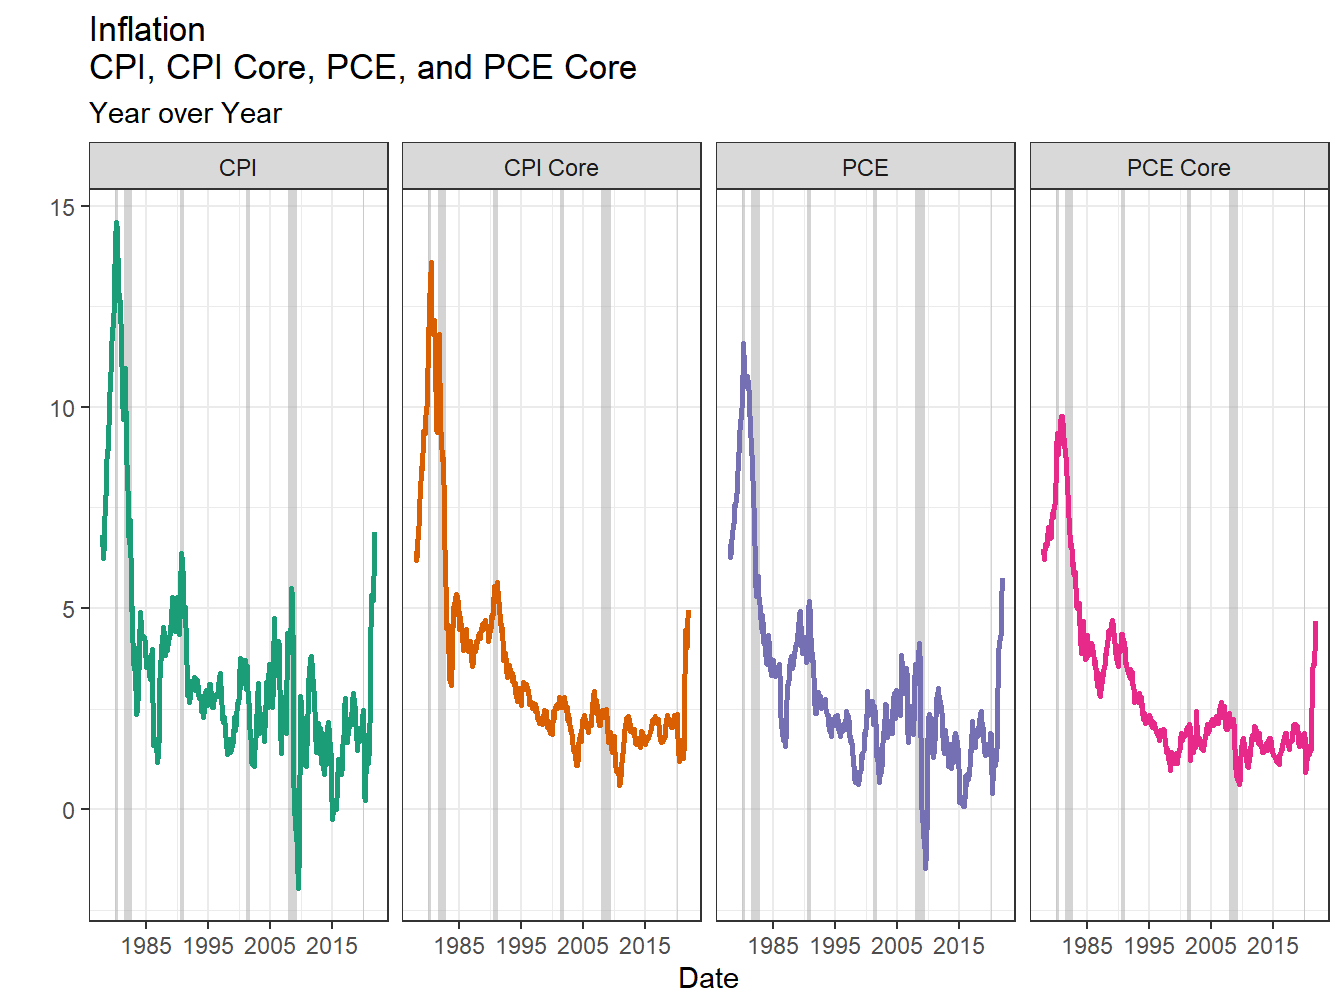
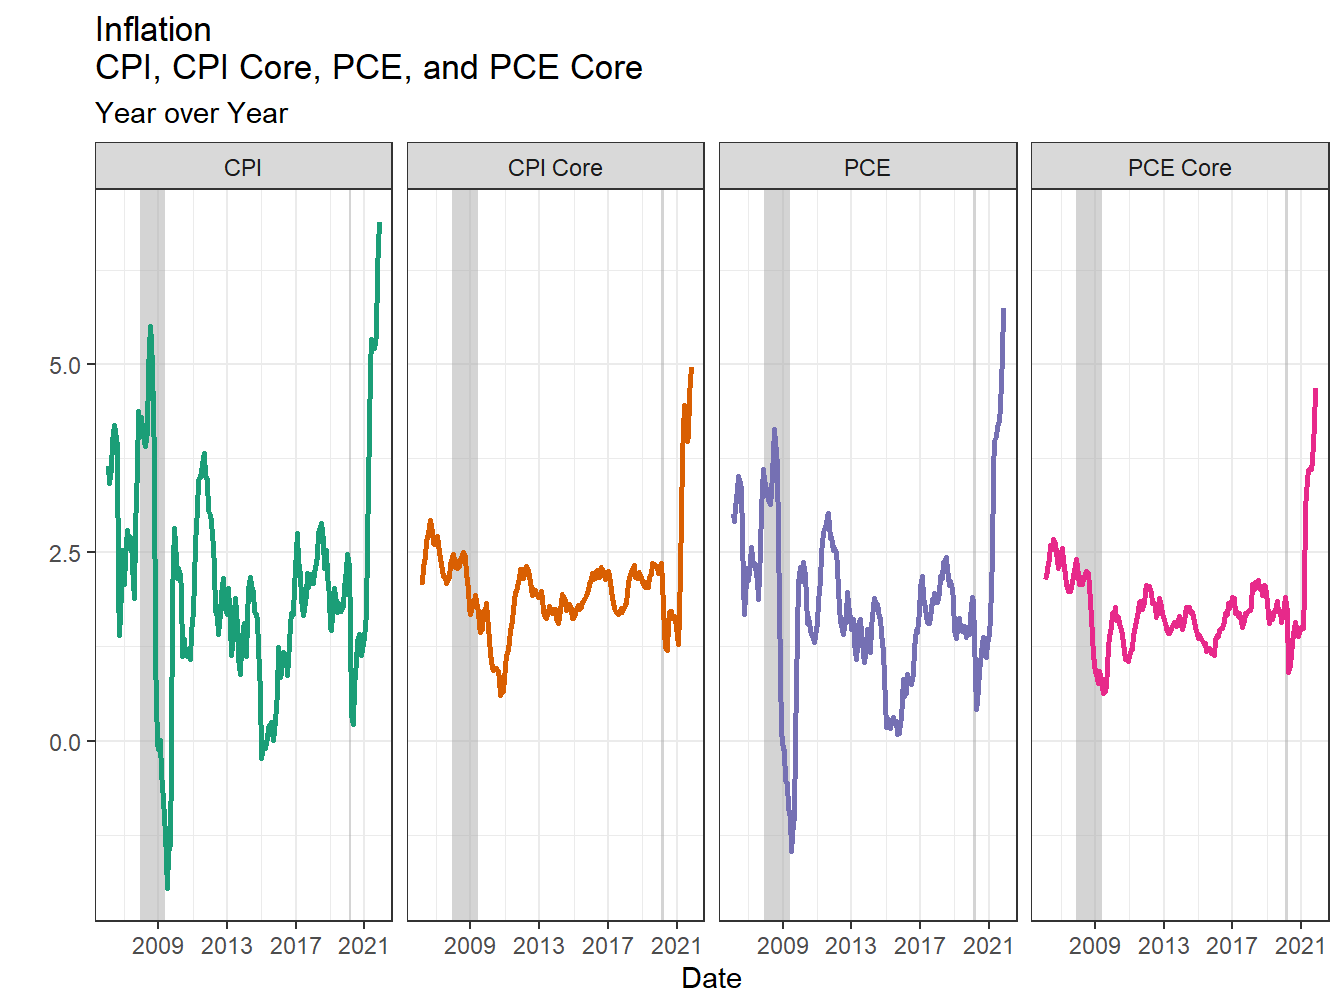
Figure 4.2: Inflation Rates Are Measuring the Change in the Price Level