Chapter 1 Introduction
In Figure 1.1 below, you will see the unemployment rate for four countries averaged over each year. The unemployment rate measures the percent of people who cannot find a job in the group of those people either working or looking for work. It seems like a mouthful, but we are estimating the proportion of people who are technically in the labor force.
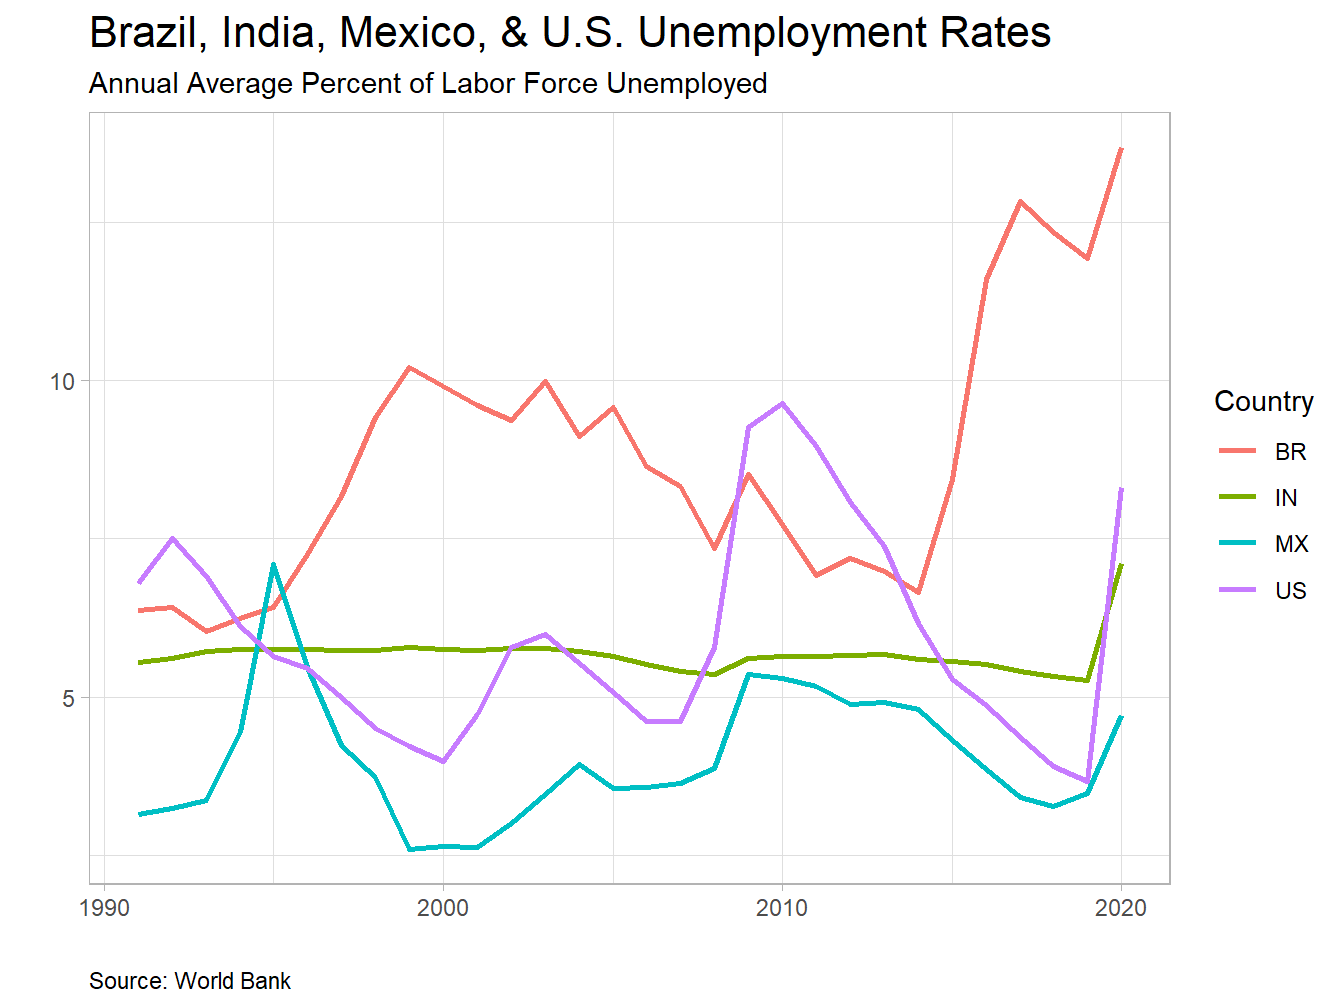
Figure 1.1: Unemployment Rates Around the World
Labor Force is the sum of those who are employed and those actively looking for work.
We measure the unemployment rate as:
\[ \text{Unemployment Rate} = \frac{\text{Unemployed}}{\text{Unemployed} + \text{Employed}} \times 100 \]
Something important about Figure 1.1 is that we can see in some countries the unemployment rate is much higher than in other countries. Partially this is because we do not all use the same measurements for those who are either technically unemployed or working. However, if we assume countries do a consistent job in measuring these rates, the changes are still somewhat accurate. For example, in the United States a monthly survey of about 60,000 households counts those considered unemployed not just as those people collecting unemployment payments, but also includes all those people who have actively sought work in the past four weeks (Bureau of Labor Statistics).
In 2020, the COVID-19 crisis gripped the world and put our global economy in a precarious position. As we can see from Figure 1.2 there has been a dramatic increase in the number of people who are newly jobless. Also, other metrics like vehicle miles travelled in the U.S. have crashed dramatically (Figure 1.3).
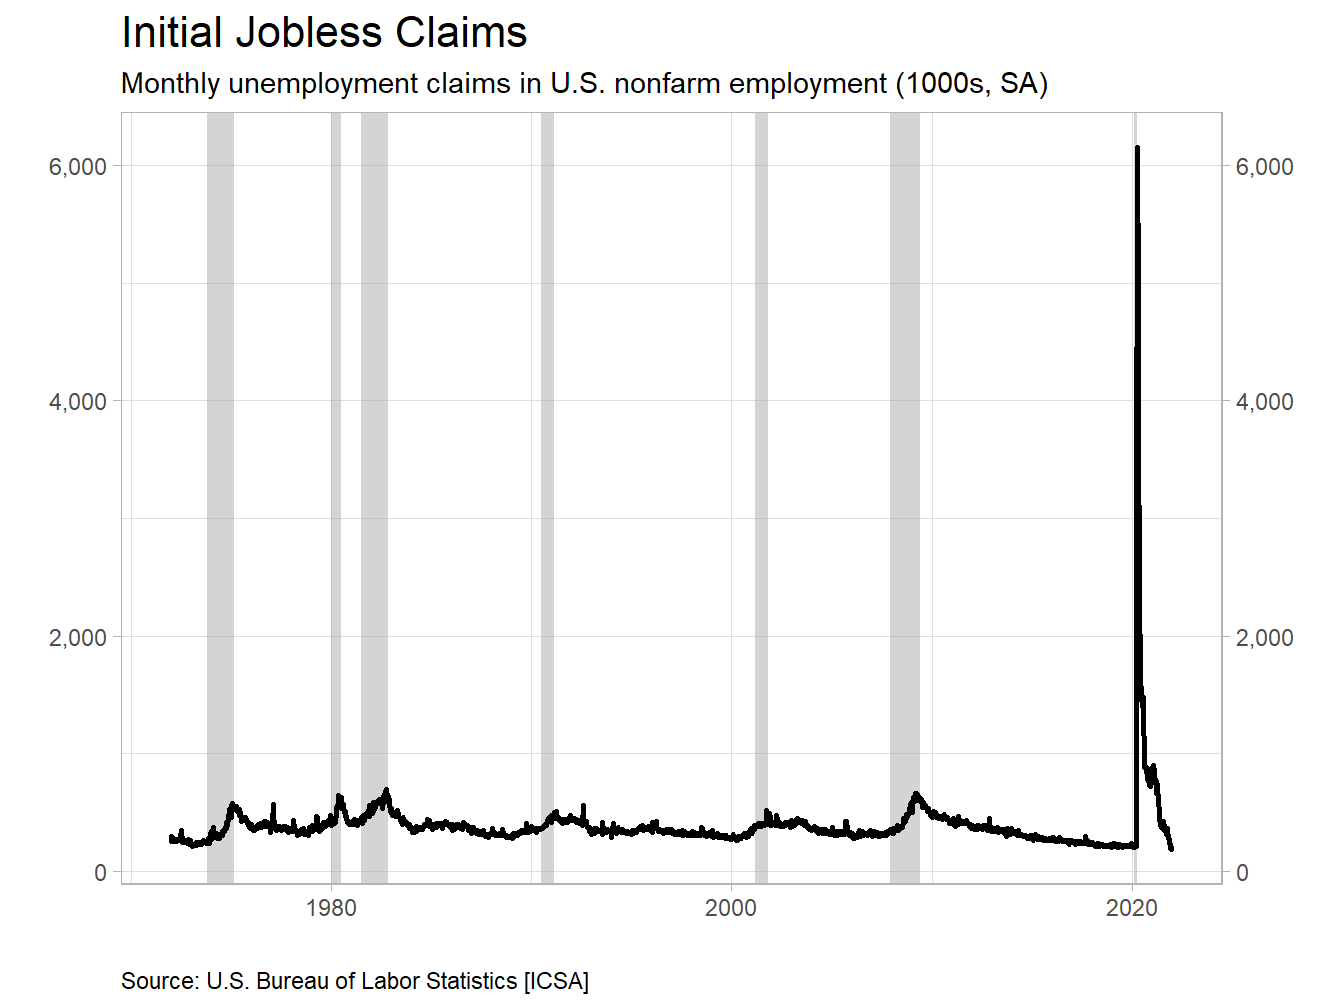
Figure 1.2: Jobless Claims Skyrocket in 2020
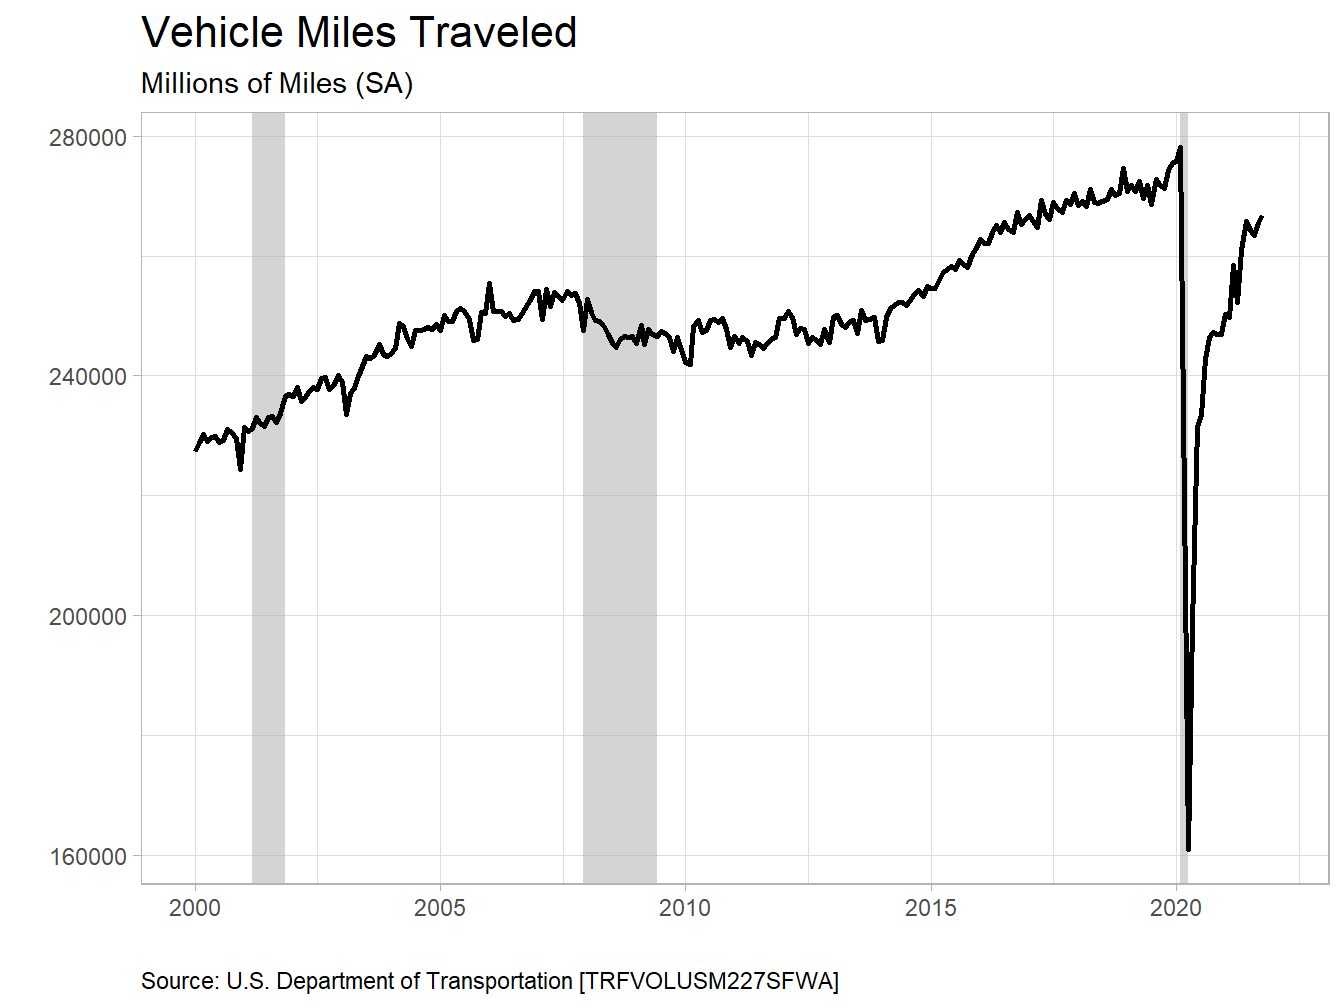
Figure 1.3: Travel Collapses in 2020
Table 1.1 shows the initial claims data for the past fifteen weeks, going back to the first weeks of the crisis in early March. Notice that the number of people filing for unemployment rose by a factor of more than ten! These unemployment claim numbers had literally never occurred in the U.S. before.1
| Date | Claims |
|---|---|
| 2019-05-01 | 218 |
| 2019-06-01 | 223 |
| 2019-07-01 | 216 |
| 2019-08-01 | 218 |
| 2019-09-01 | 217 |
| 2019-10-01 | 216 |
| 2019-11-01 | 219 |
| 2019-12-01 | 218 |
| 2020-01-01 | 210 |
| 2020-02-01 | 216 |
| 2020-03-01 | 5,985 |
| 2020-04-01 | 3,451 |
| 2020-05-01 | 1,605 |
| 2020-06-01 | 1,436 |
| 2020-07-01 | 1,262 |
| 2020-08-01 | 875 |
| 2020-09-01 | 803 |
| 2020-10-01 | 765 |
| 2020-11-01 | 719 |
| 2020-12-01 | 763 |
| 2021-01-01 | 837 |
| 2021-02-01 | 761 |
| 2021-03-01 | 729 |
| 2021-04-01 | 590 |
| 2021-05-01 | 388 |
| 2021-06-01 | 368 |
| 2021-07-01 | 387 |
| 2021-08-01 | 345 |
| 2021-09-01 | 364 |
| 2021-10-01 | 271 |
| 2021-11-01 | 227 |
| 2021-12-01 | 198 |
For brevity, the weekly data here is summarized into monthly by taking the final week of each month and attributing it to the full month.↩︎