Chapter 3 Labor Market Measures
3.1 Labor Force Participation
The labor market is one of the most important and relevant macroeconomic measures of health.1 There are several different measures of labor market health. First, we might like to know what portion of eligible workers are engaged in either working or job search. We measure this using the labor force participation rate (LFP). The LFP tends to rise and fall with long-term economic trends, like women entering the workforce or the reduction in manpower necessary for manufacturing. We calculate the LFP as:
\[ \text{LFP} = \frac{\text{Unemployed}+\text{Employed}}{\text{Eligible Population}} \times 100 \]
We can see that structural forces shift labor force participation (Figure 3.1). However, LFP does change with cyclical events, such as the case with the recent COVID-19 pandemic.
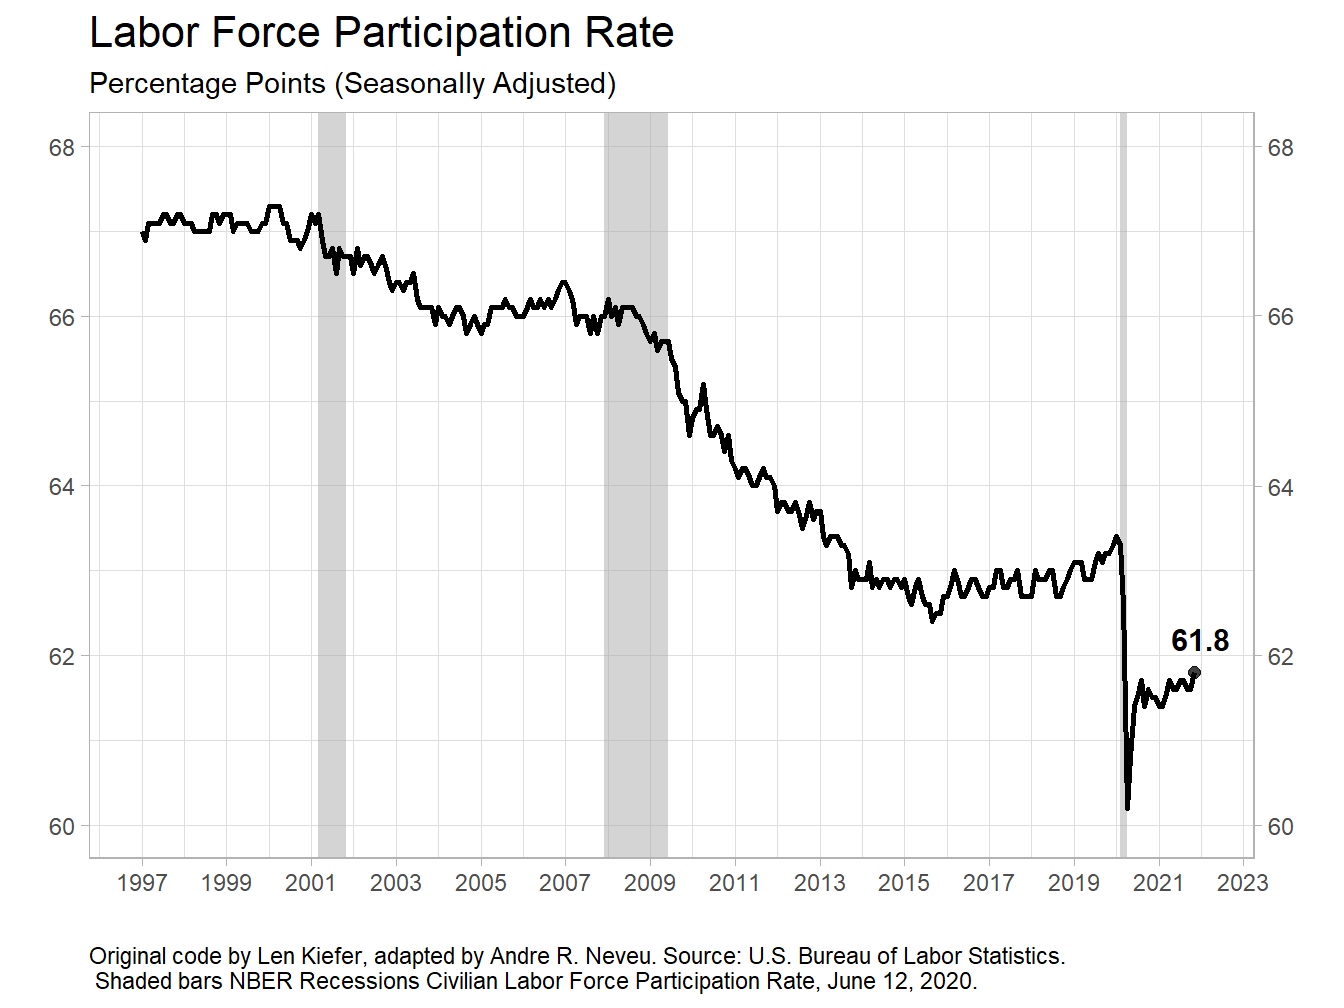
Figure 3.1: The Workforce Shows Structural and Cultural Changes
3.2 Job Growth
Another way to look at the health of the labor market is to look at job growth. Job growth in the U.S. had been going very strong until the COVID-19 pandemic in early 2020. Note that in Figure 3.2 there had been positive gains in growth for over ten years! Prior to the COVID-19 pandemic, healthy job growth was considered to be about 200,000 jobs per month.
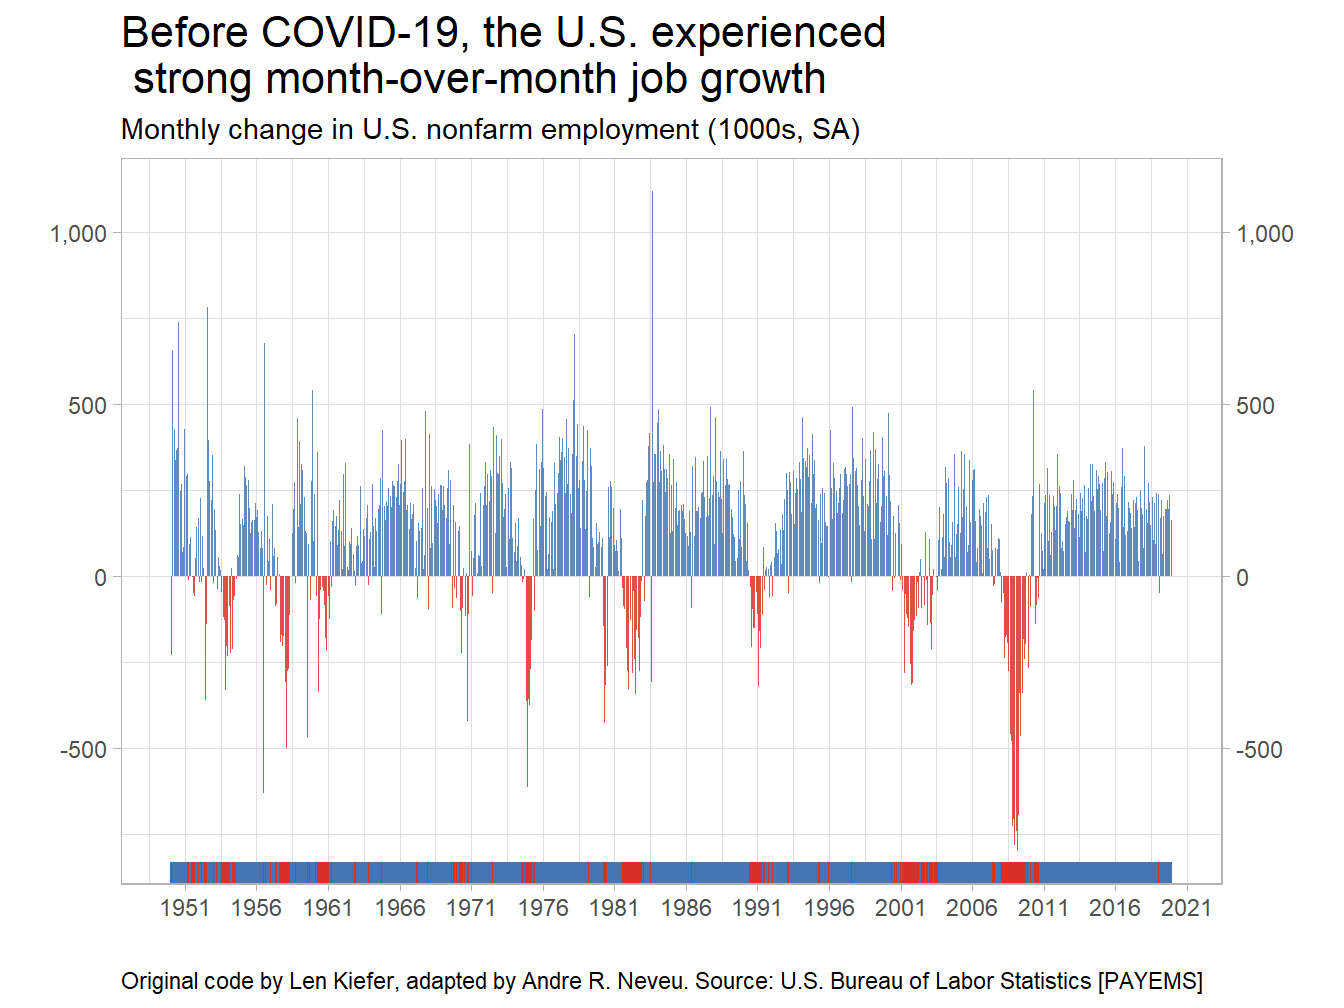
Figure 3.2: Job Gains Had Persisted for a Historically Long Stretch
The COVID-19 pandemic is unlike anything we have ever experienced in the U.S., so much so that the scale of all previous changes appear nearly irrelevant. Note that Figure 3.3 is the same as Figure 3.2 but focuses on the periods since the start of the Great Recession in late 2007.
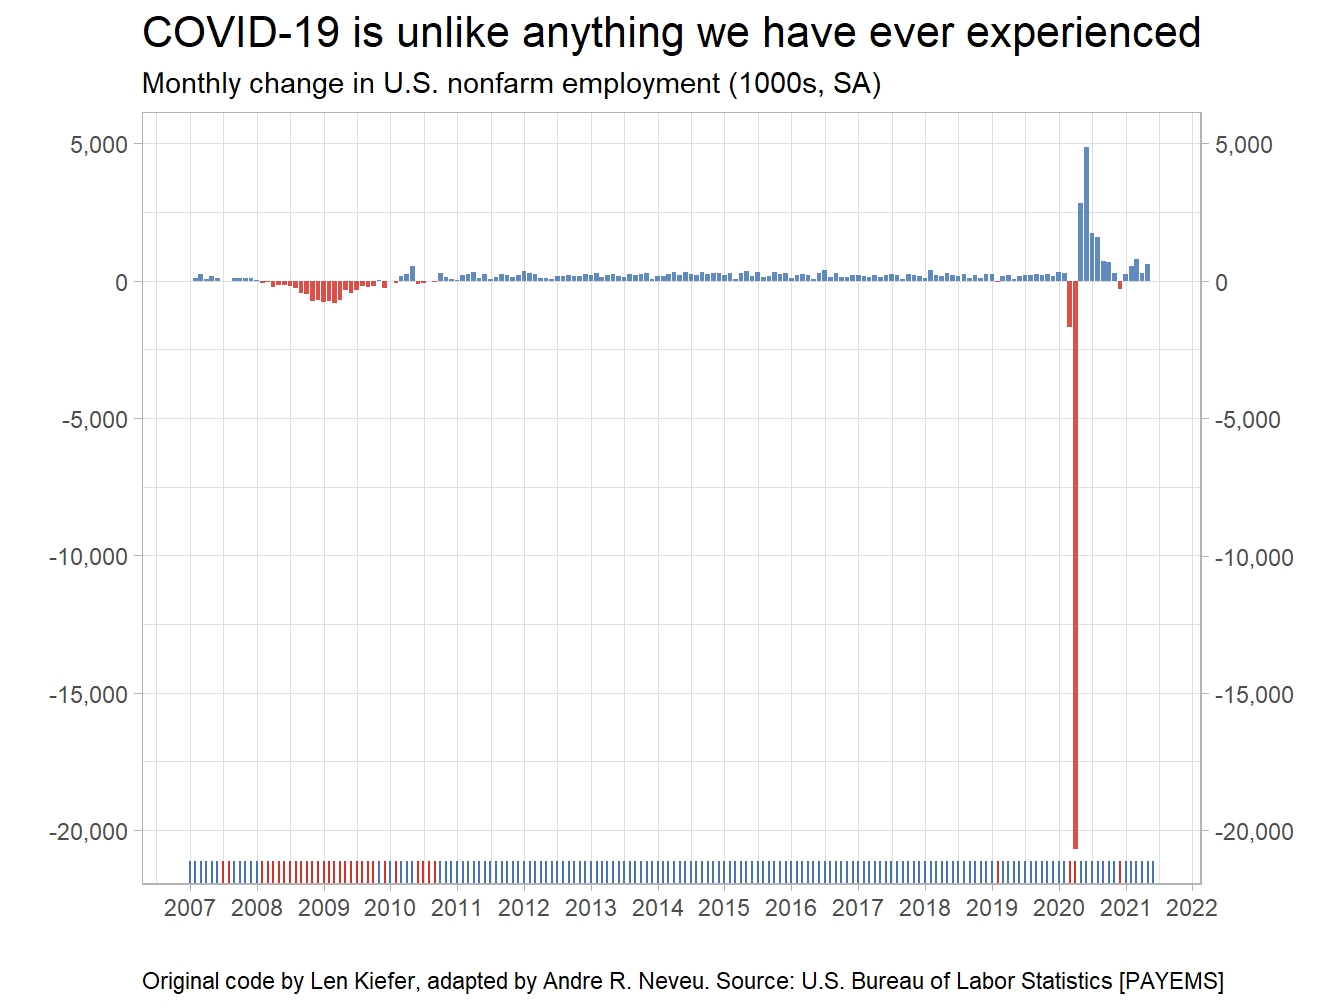
Figure 3.3: The COVID-19 Job Losses Are Stunning
3.3 Unemployment Rates
The unemployment rate is a different measurement than labor-force participation. Unemployment rates only look at the percentage of the labor force that cannot find work. The labor force is the numerator in the calculation of the LFP, and sometimes when people lose a job they leave the labor force entirely. This complicates our perception of the health of the labor market when some people are both losing jobs–leaving the numerator of the unemployment rate–and also leaving the labor force. In mid-2020, people are both filing for unemployment–which means they stay in the labor force–and dropping out of the labor force.
\[ \text{Unemployment Rate} = \frac{\text{Unemployed}}{\text{Unemployed} + \text{Employed}} \times 100 \]
The unemployment rate is often compared to a conceptual measure known as the natural rate of unemployment. This natural rate is what economists estimate the unemployment rate would have to be in order to keep the economy producing at it’s potential. Potential output is somewhat confusing, as it really means the country is producing goods and services at a sustainable level and not the absolute maximum. You might think of potential output more like a pace you could sustain while jogging, but not an all-out sprint! The estimated natural rate of unemployment considers what we have talked about so far. Strong participation, healthy job growth, and availability of jobs making for a healthy labor market.
We can see in Figure 3.4 that the unemployment rate in early 2020 was at an historic low, and was well below what economists considered natural. When the economy is not doing so well, the labor market tends to be one of the most important signals. Thus, the unemployment rate usually rises rapidly during recessions when the economy and output is contracting.
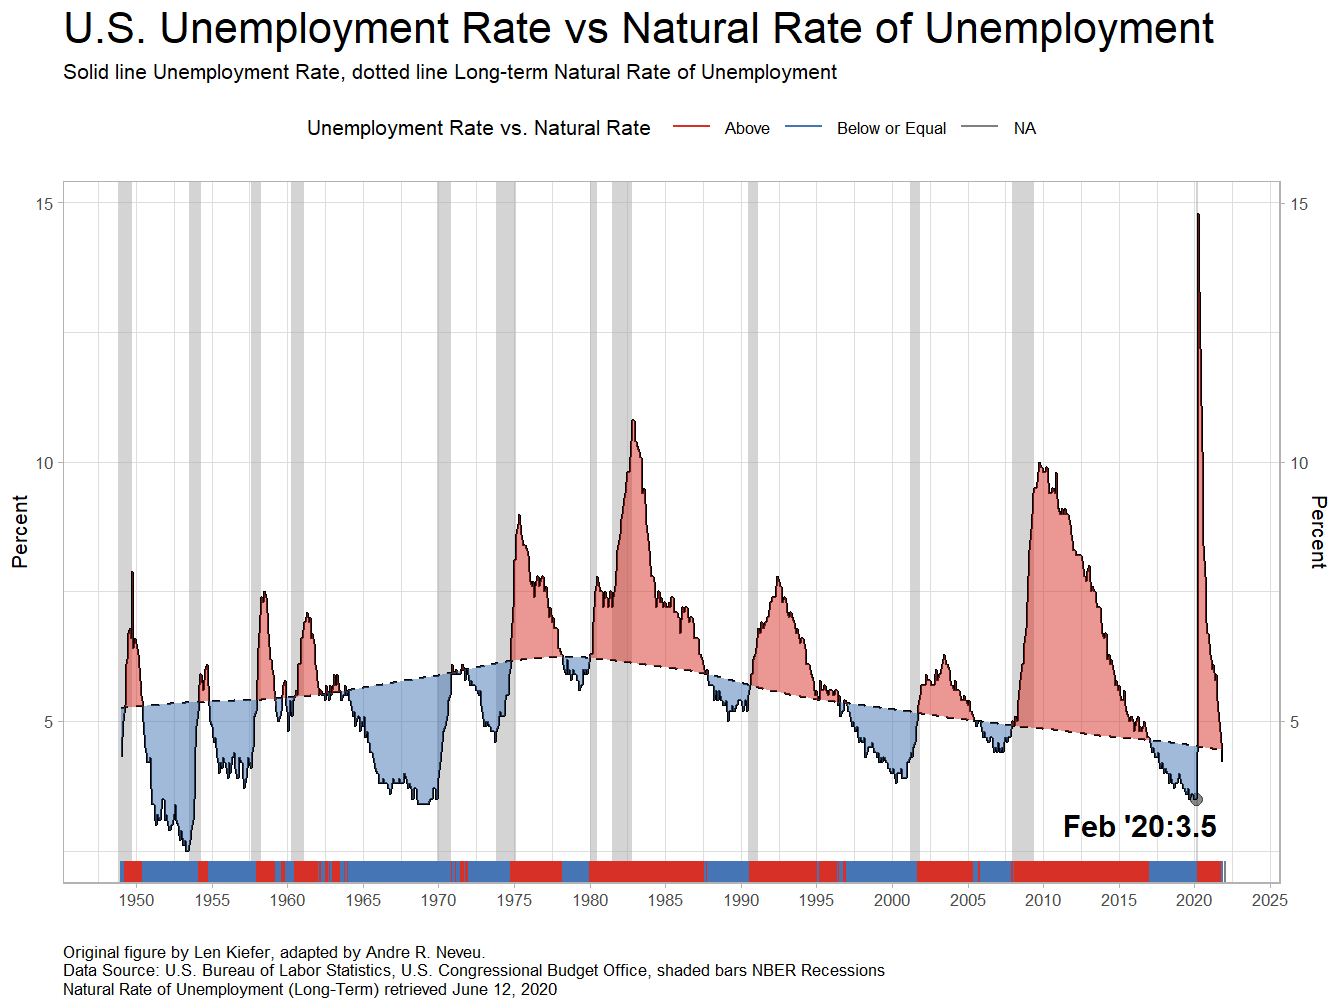
Figure 3.4: Unemployment Rates Had Been Historically Low
3.4 Long-Run Trends v. Short-Run Changes
Over time the percentage of men of prime working age (25-54) has fallen, while for women the rate has risen quite significantly. We can see that in the short run there has been a rather large negative shock to participation in the labor force due to the COVID-19 pandemic. This crisis impacted both men and women. A bigger change has appeared in the employment to population ratio which is now at only a level of 58%, nearly 3% lower than before the COVID-19 pandemic began. This is the lowest the employment-to-population ratio has been since 1983, a period before millions of women entered the labor force.
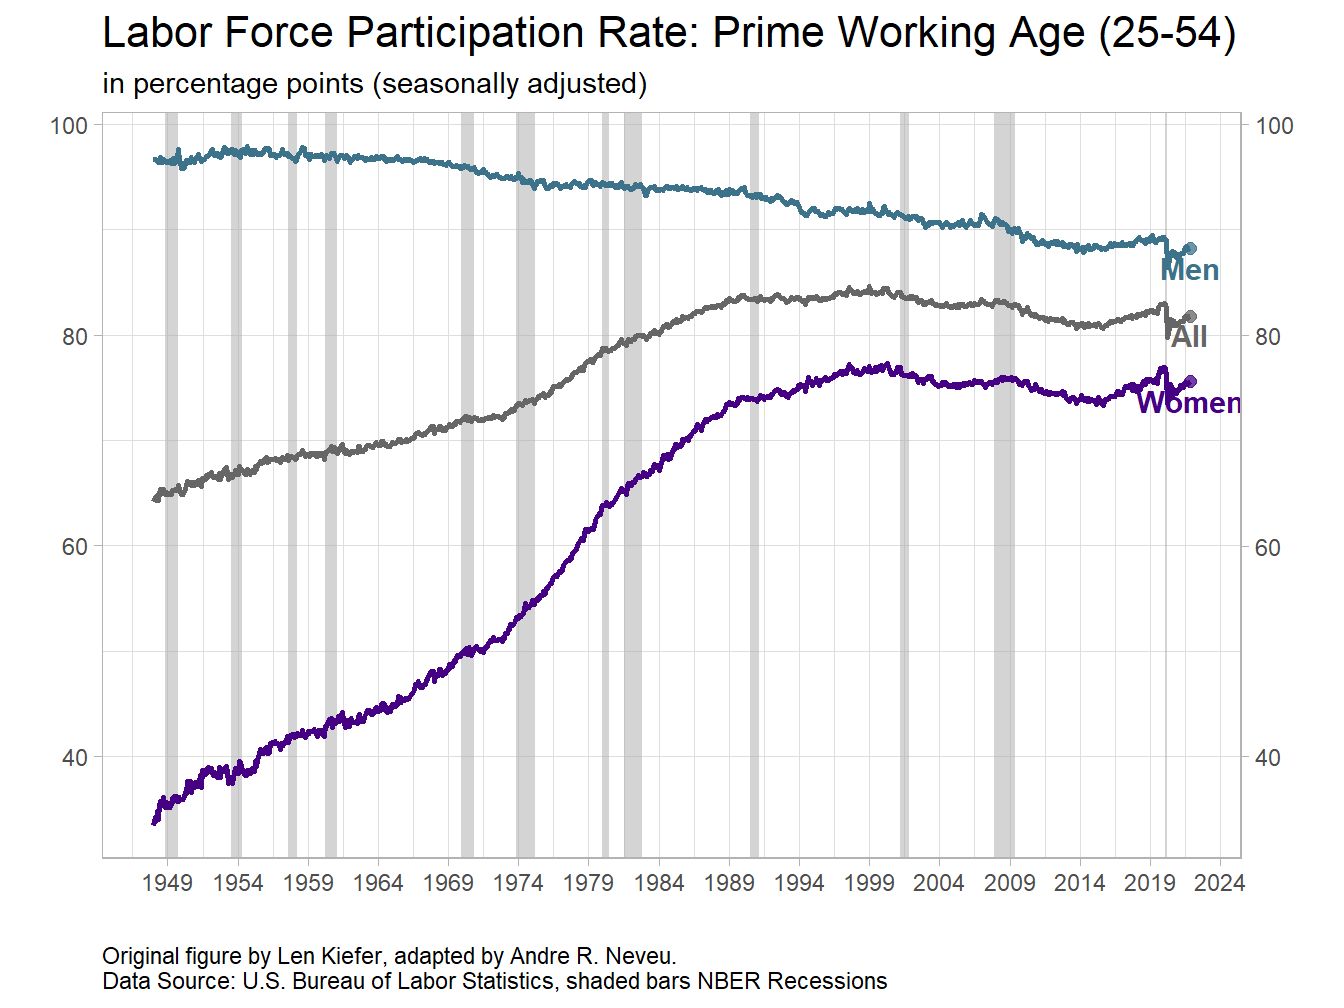
Figure 3.5: Labor Force Participation Has Plummeted
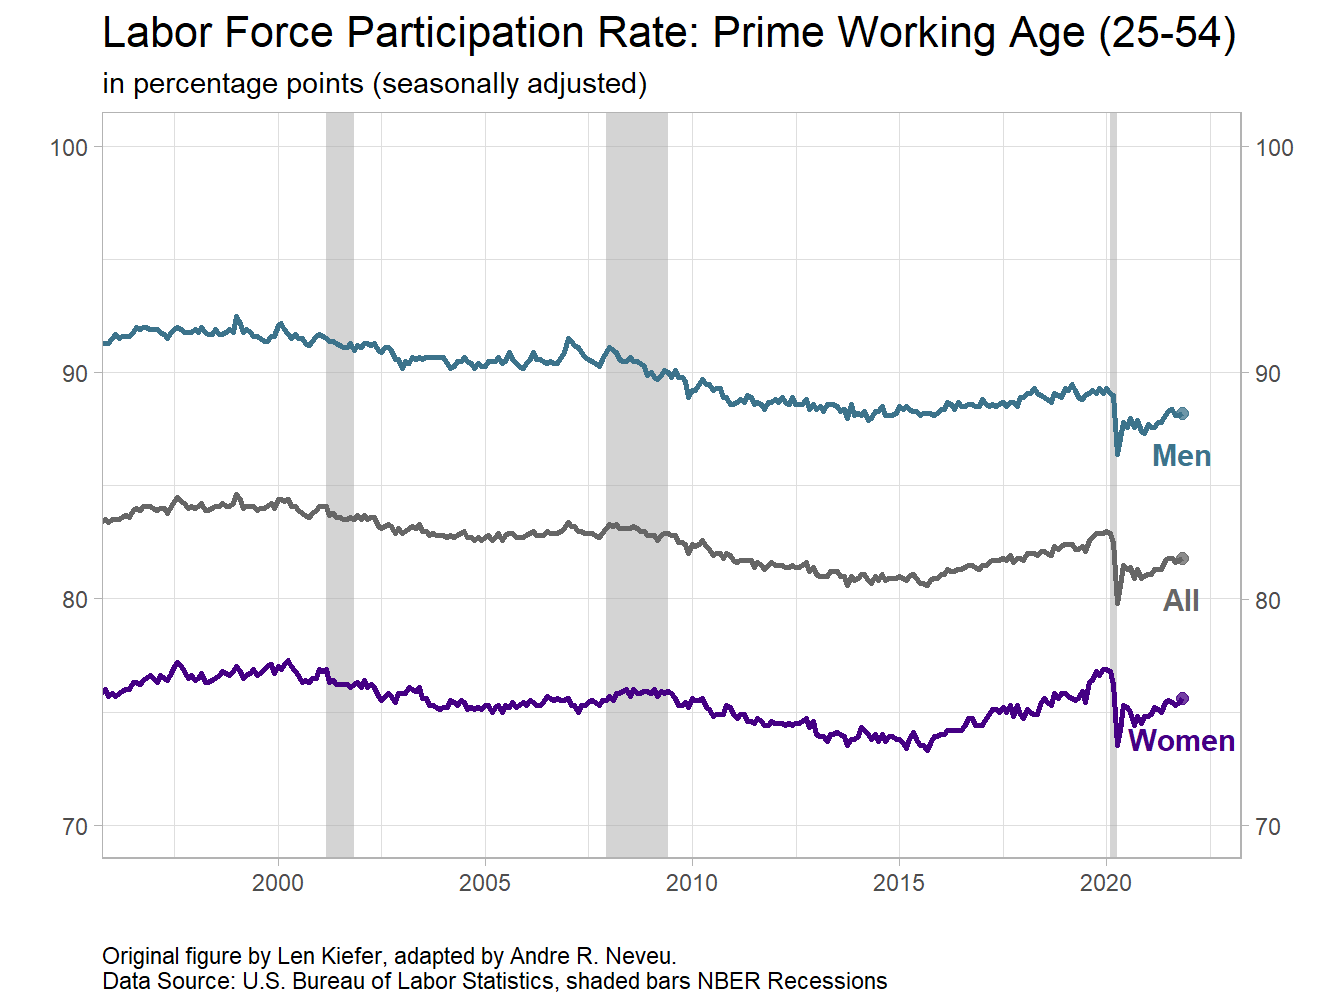
Figure 3.6: The Change is Simiilar Across Gender
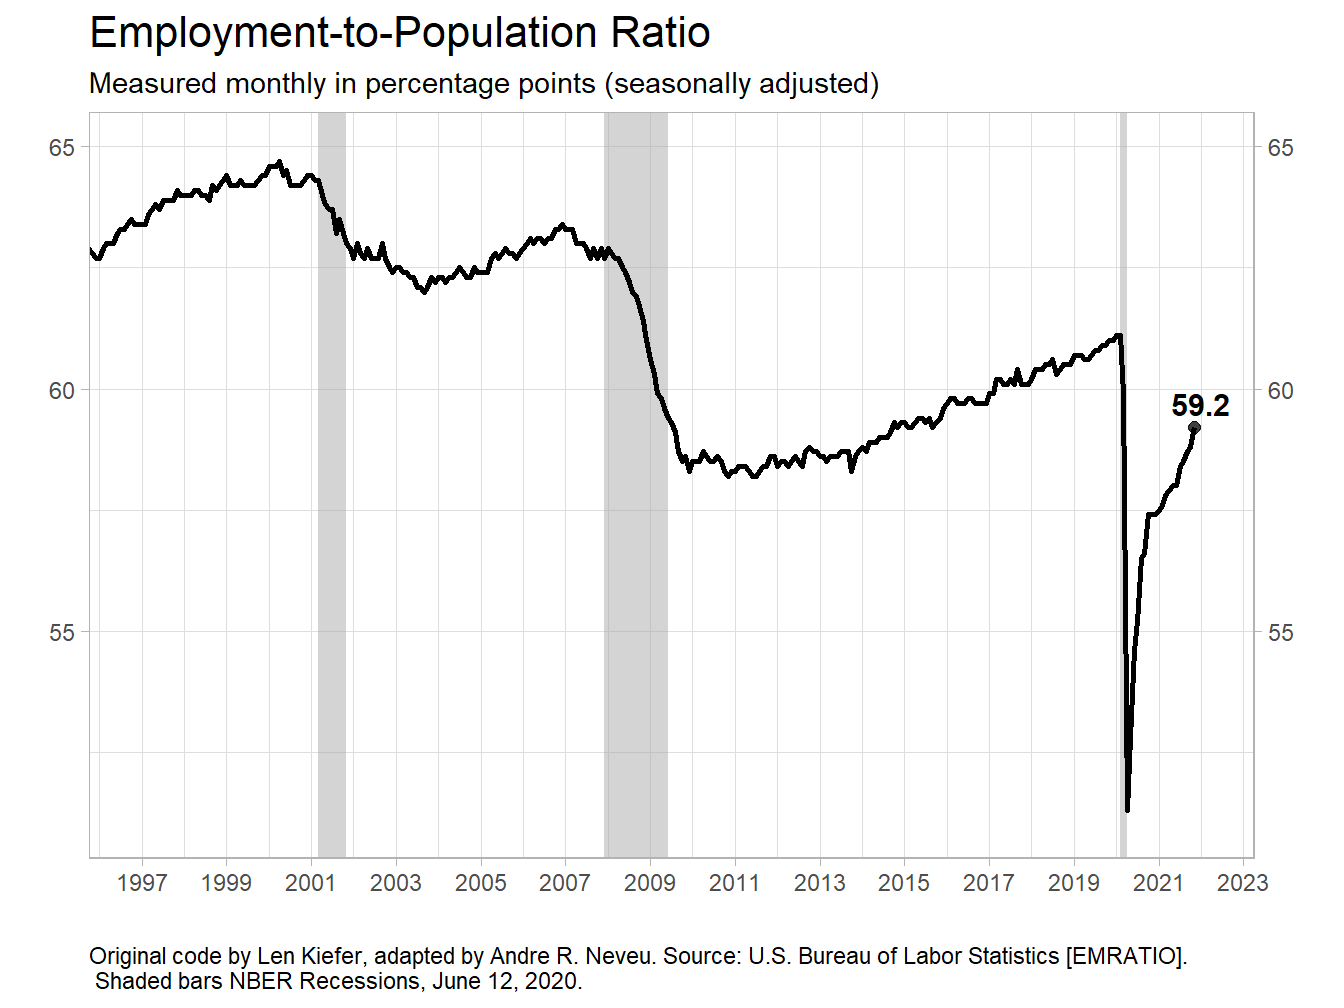
Figure 3.7: Expectedly, the Percentage of All People Employed Has Fallen
Many of the graphs here are adapted from code available from Len Kiefer’s blog post http://lenkiefer.com/2018/03/11/charting-jobs-friday-with-r/.↩︎